Getting started
First connection and the workbench.
Connect to your first database, then learn where everything is: the sidebar, the tabs, the editor, the grid and the panels on the right.
Your first connection#
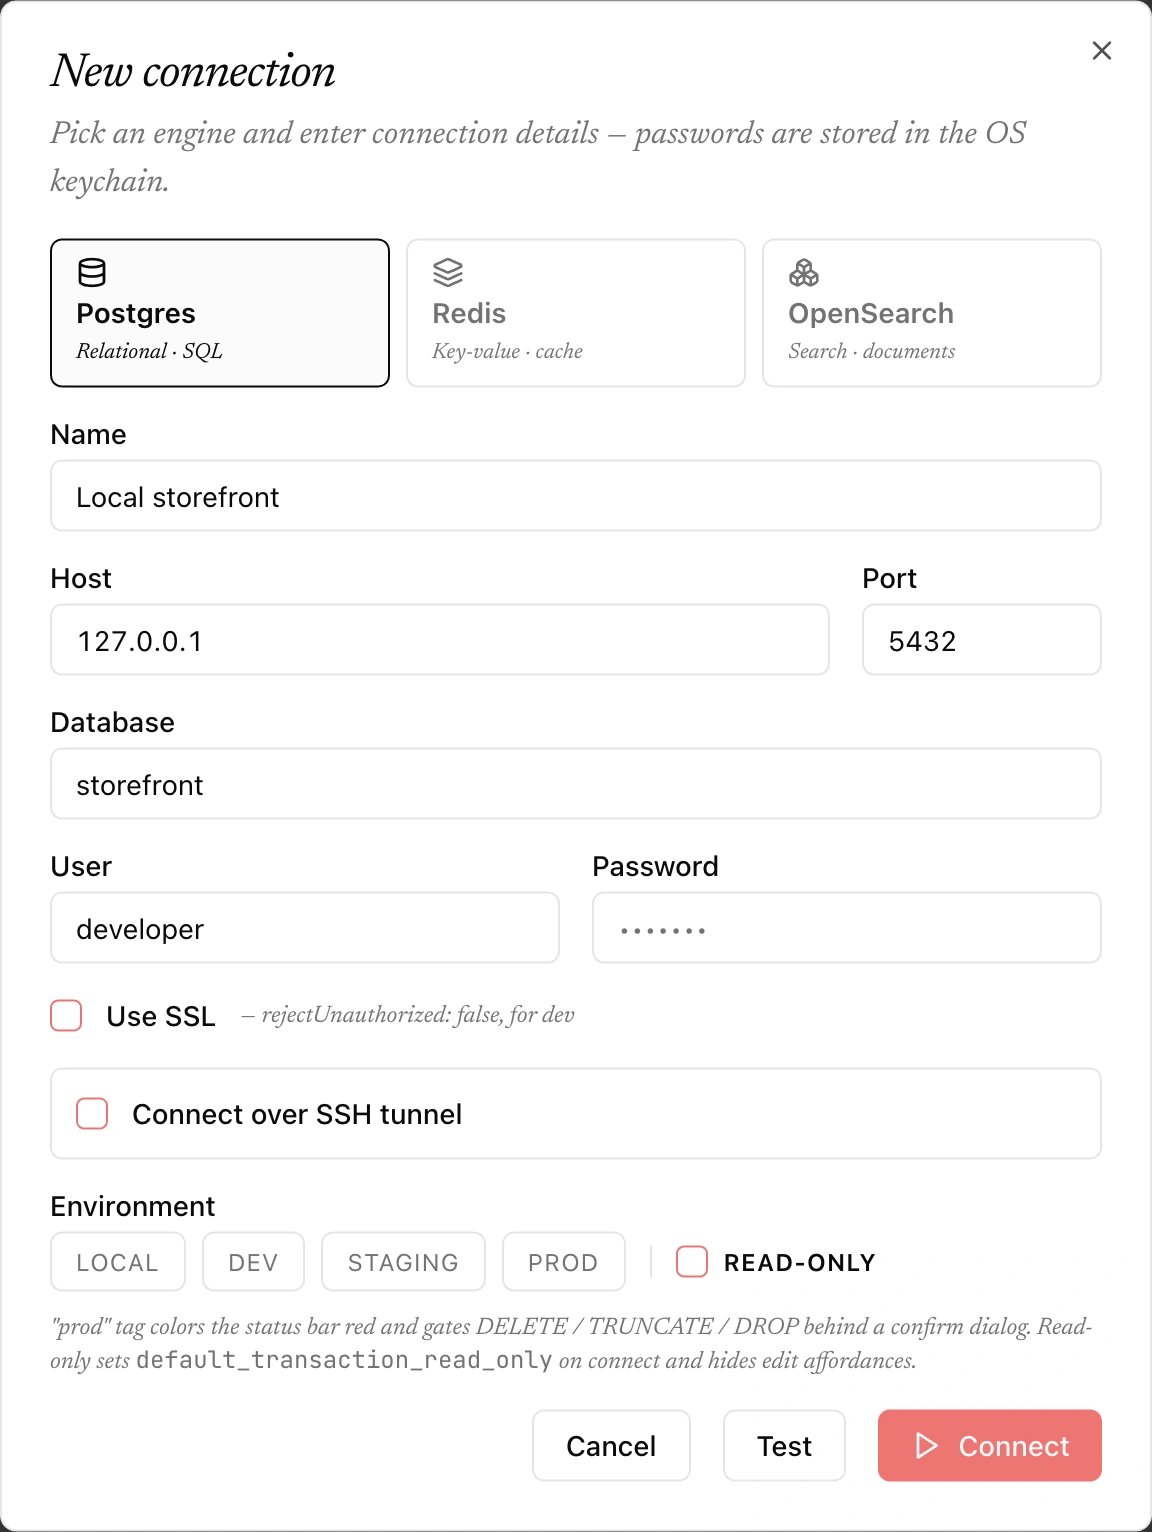
When Plasma has no connection open it shows the Connections home. Until you save one it says No saved connections yet. Click New connection to start.
- 01
Paste a URL, or pick an engine
The first screen is Add a connection. Either paste a connection URL into Paste a connection URL, or choose one of the seven engines: PostgreSQL, MySQL · MariaDB, SQLite, ClickHouse, DuckDB, Redis or OpenSearch. Each card shows its default port (or “Local file”). Arrow keys move between the cards and Enter chooses one.
- 02
Fill in the form
The form has cards for Connection, Server, Authentication, Security, SSH tunnel and Advanced; a list on the side jumps to each one and marks it complete or in error. SQLite and DuckDB only have Connection, Server and Advanced because a file has no network, login or tunnel. Every field is described on the Connections page.
- 03
Test it
Test walks through the connection one step at a time (find the host, reach the port, TLS, log in, open the database) and stops at the first step that fails. A failure is explained in plain words with the likely fix.
- 04
Connect or save
Connect saves and connects (⌘⏎Ctrl+Enter). Save keeps the connection without connecting.
The workbench#
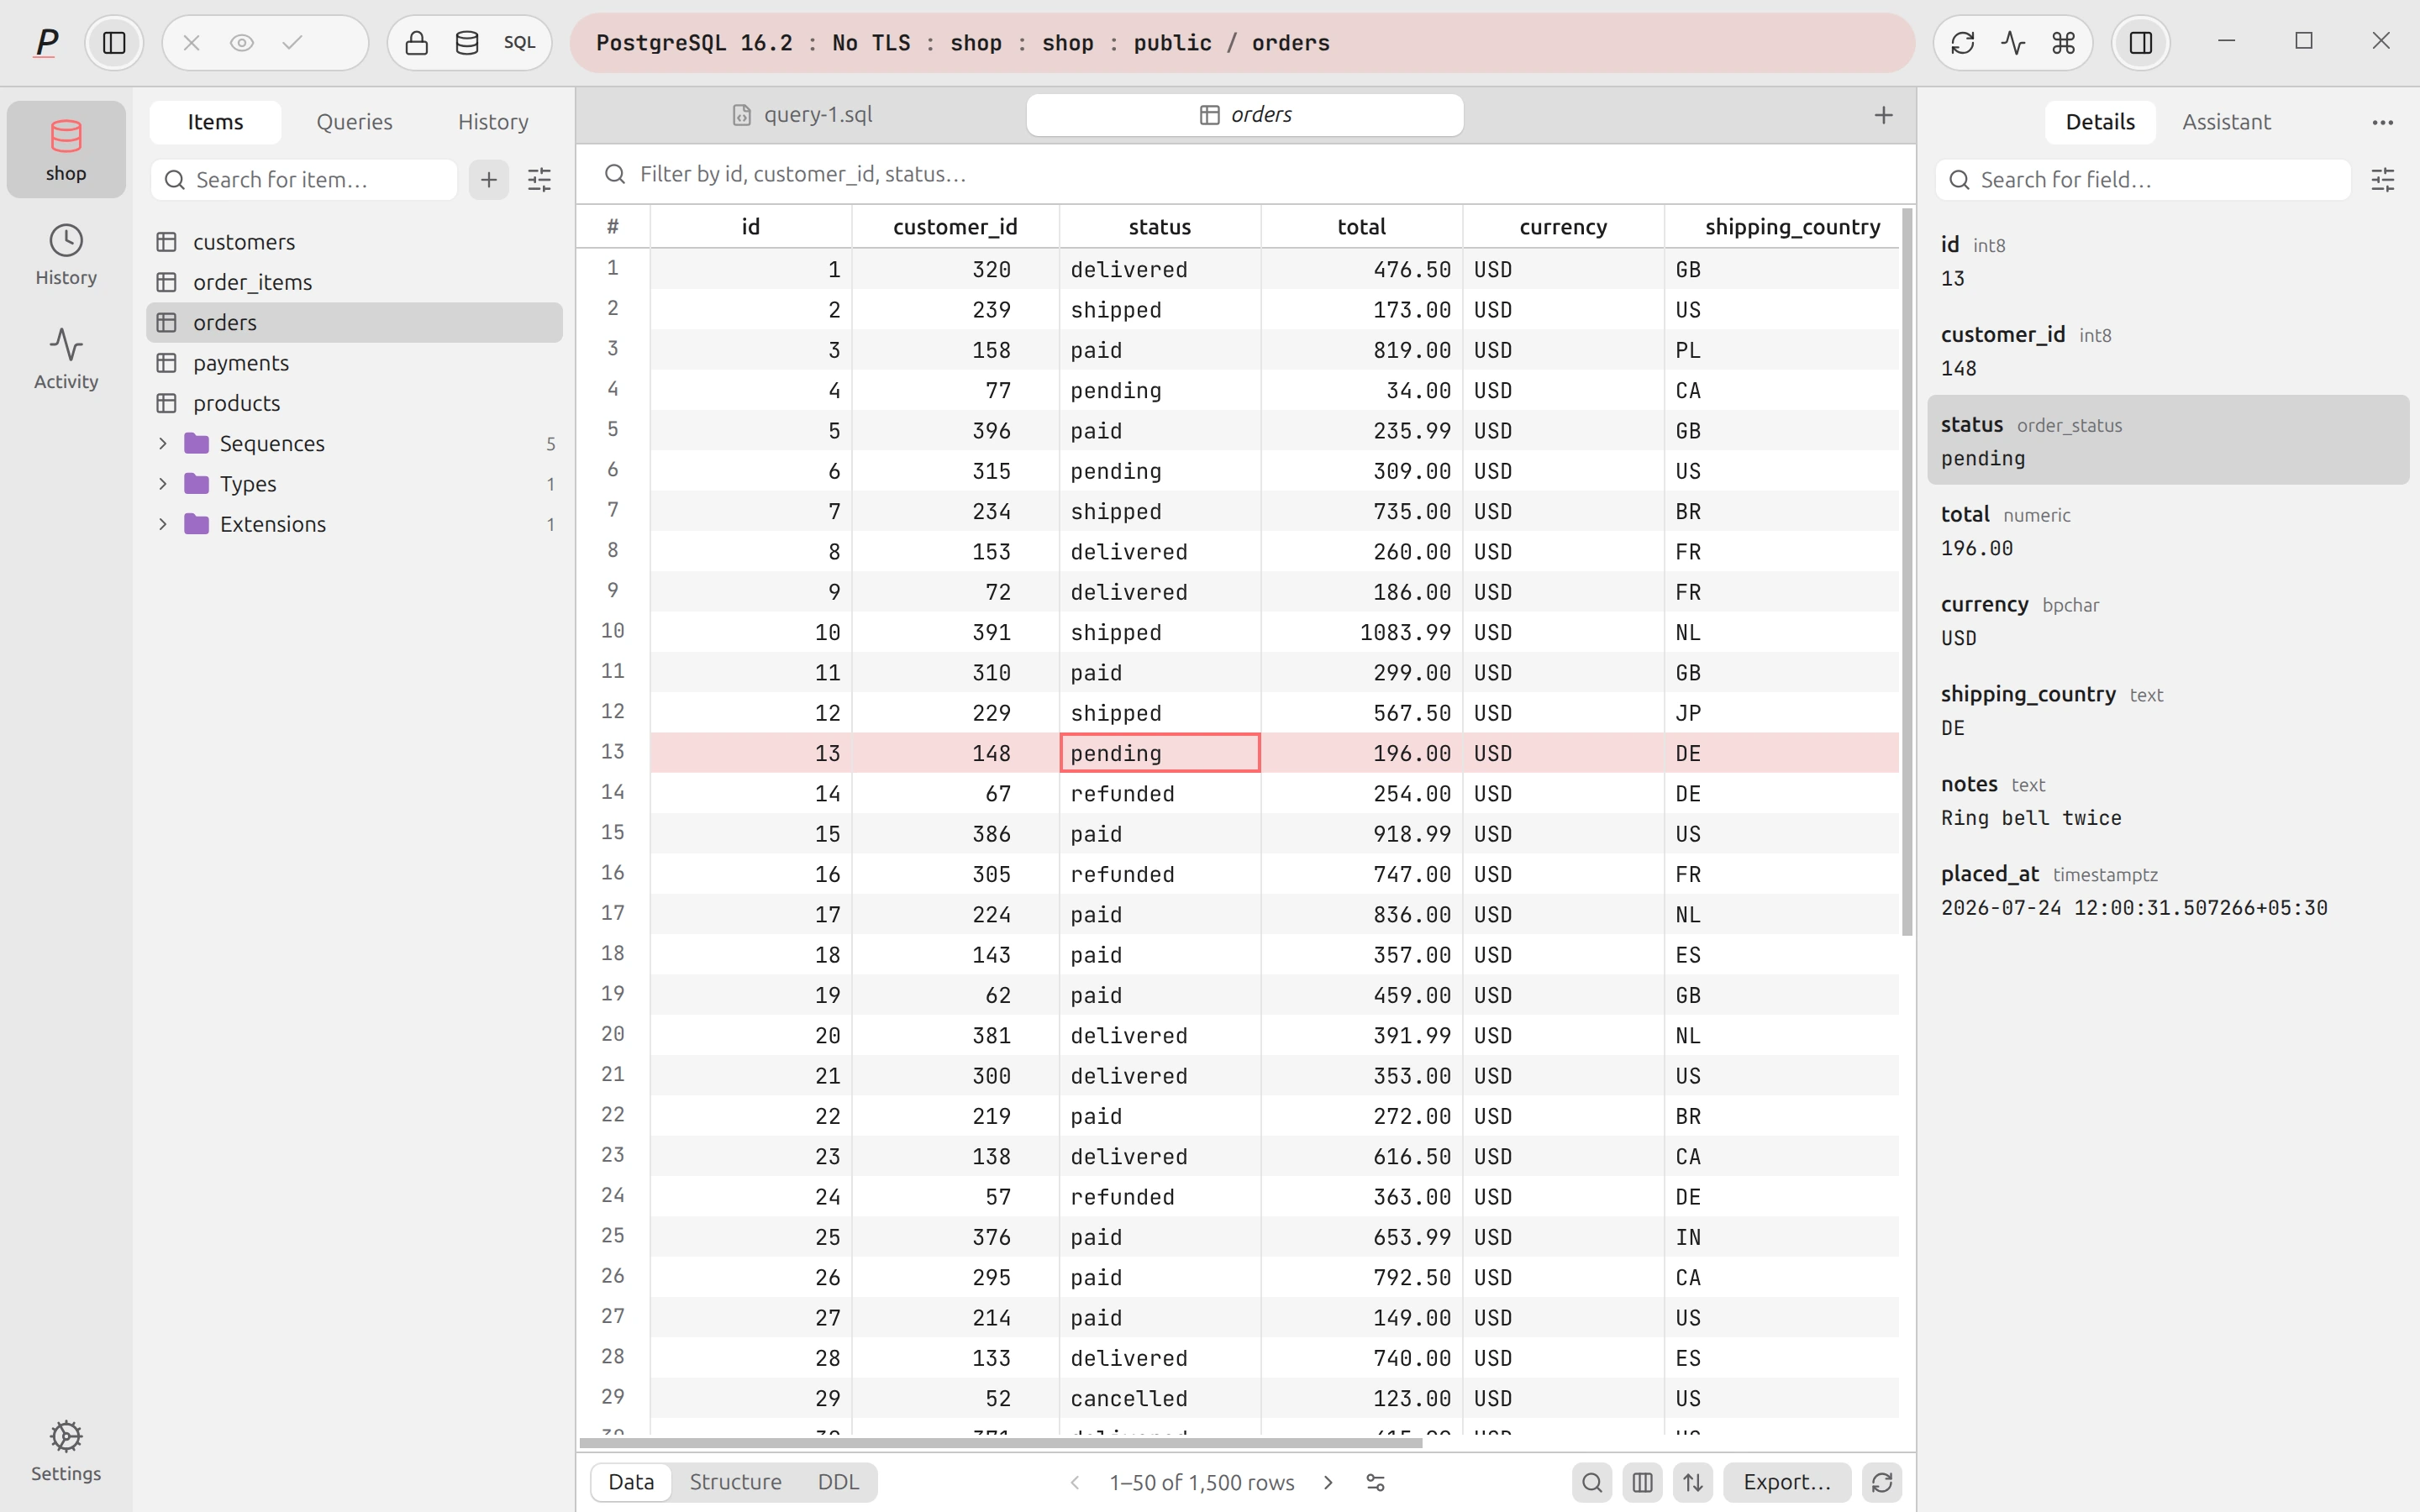
The window is built from a few fixed parts.
| Part | What it does |
|---|---|
| Icon rail | Far left. The database tile (tables and queries), History (SQL engines), Health (Postgres, Redis and OpenSearch) and Settings. |
| Top bar | Hide or show the left sidebar; the lock button that turns edit mode on and off; the connection switcher; New SQL query; reload; presentation mode; Open anything (the command palette); the right sidebar. The connection capsule shows the engine, server, database and schema, and its colour shows the status. |
| Left sidebar | Three modes: Items (tables, views and other objects), Queries (saved queries and snippets) and History. Redis and OpenSearch replace it with a key tree and an index list. |
| Tab strip | One tab per table or SQL script. Close, rename, duplicate and split from the tab menu. |
| Editor and results | The SQL editor on top and the result grid below it, with a footer for paging, export and view switches. |
| Right sidebar | Details shows the selected row as a form. Assistant is the AI panel. A menu next to them holds Compiled SQL, Session role and Row-level security for Postgres. |
Edit mode: the lock button#
A fresh connection opens read-only for safety. The lock button in the top bar reads Safe mode — read only. Click to allow edits. Click it and the pencil appears: Edit mode — writes enabled. Click to lock. Grid editing, row inserts and deletes, and the write actions of Redis and OpenSearch all need edit mode. SQL you type in the editor is not blocked by this button; it goes through Safe mode instead.
On a connection saved as Read-only, the button is disabled and reads “Read-only connection — writes are disabled”. Engines whose rows cannot be edited in the grid (ClickHouse and DuckDB) show “Rows are read-only for this engine — write SQL in the editor instead”.
Tabs and split panes#
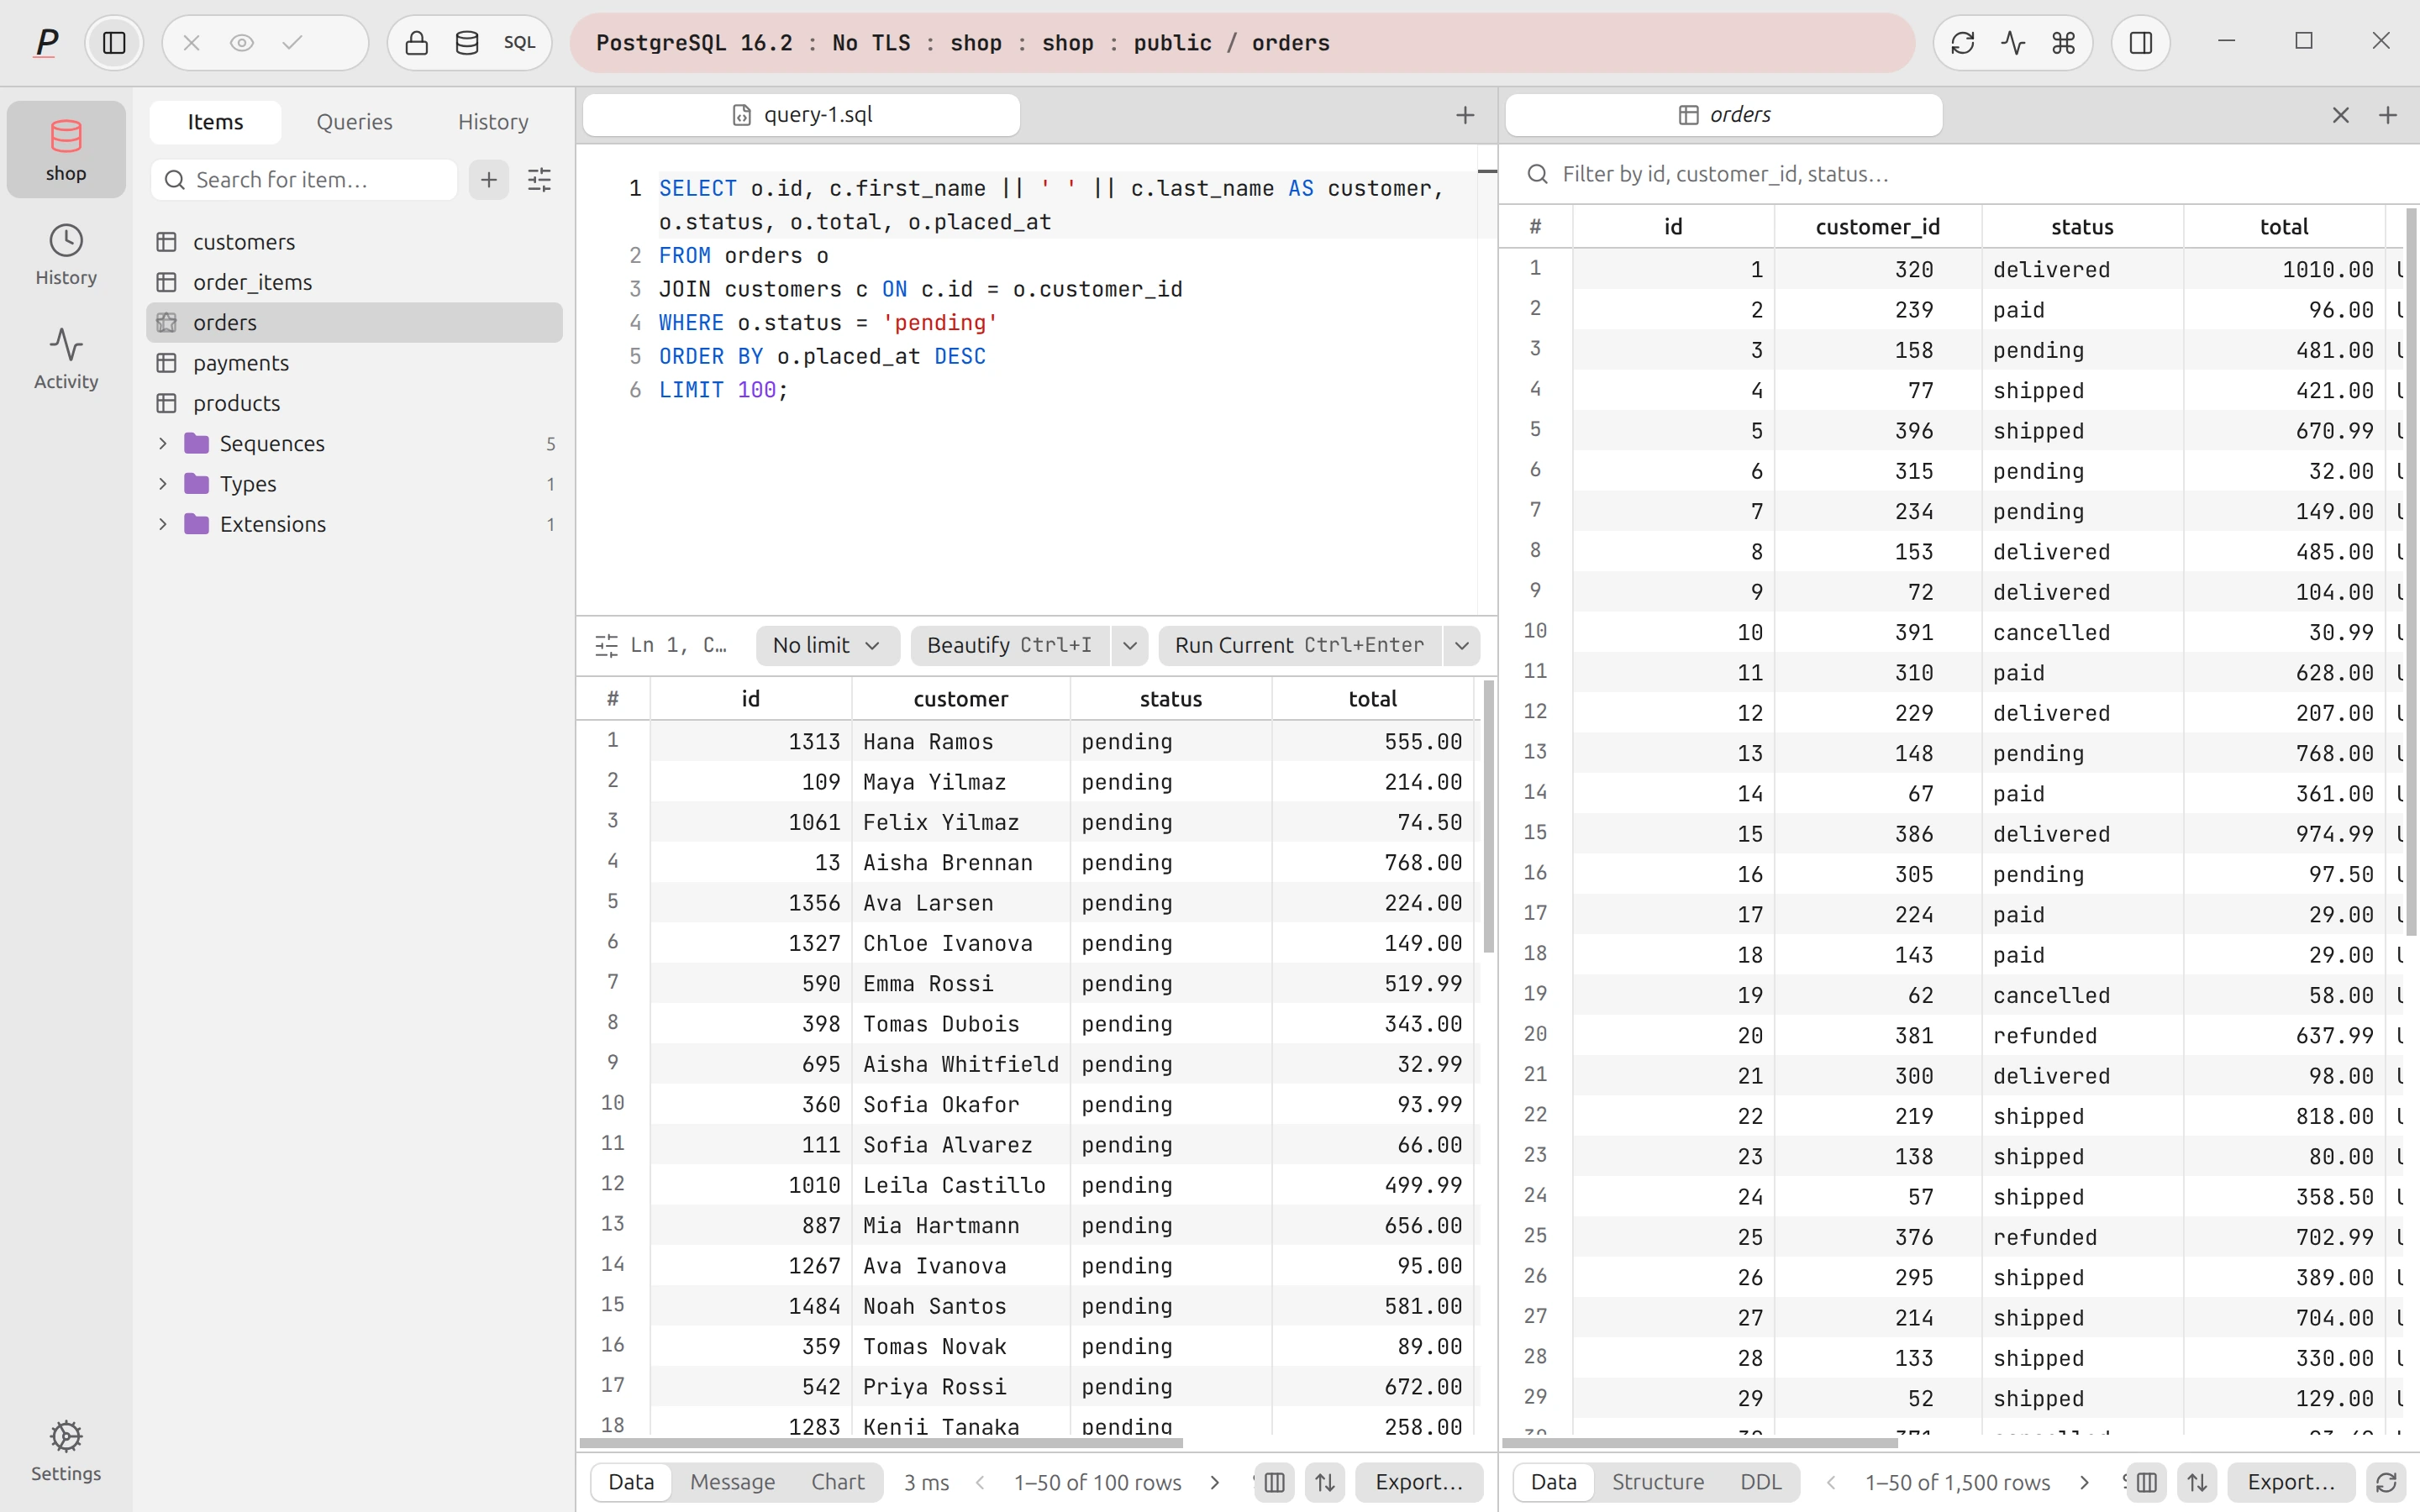
Opening a table from the sidebar opens a preview tab, shown in italics. Single-click another table and it replaces the preview. Double-click the tab, or choose Keep open from its menu, to keep it. The tab menu also has Close, Close Others, Close to the Right, Close All, Duplicate, Rename… and Split Pane Right. A tab is marked while its query is queued, running or being cancelled, and after a run that failed or whose outcome is unknown.
A split puts two tabs side by side. Next pane and Previous pane move focus between them (⌘⌥]Ctrl+Alt+] and ⌘⌥[Ctrl+Alt+[), and the tab shortcuts work inside the focused pane.
With Restore open SQL tabs on in Settings → General, your query tabs for each connection come back the next time you connect. See Crash recovery for what survives a crash.
Open anything: the command palette#
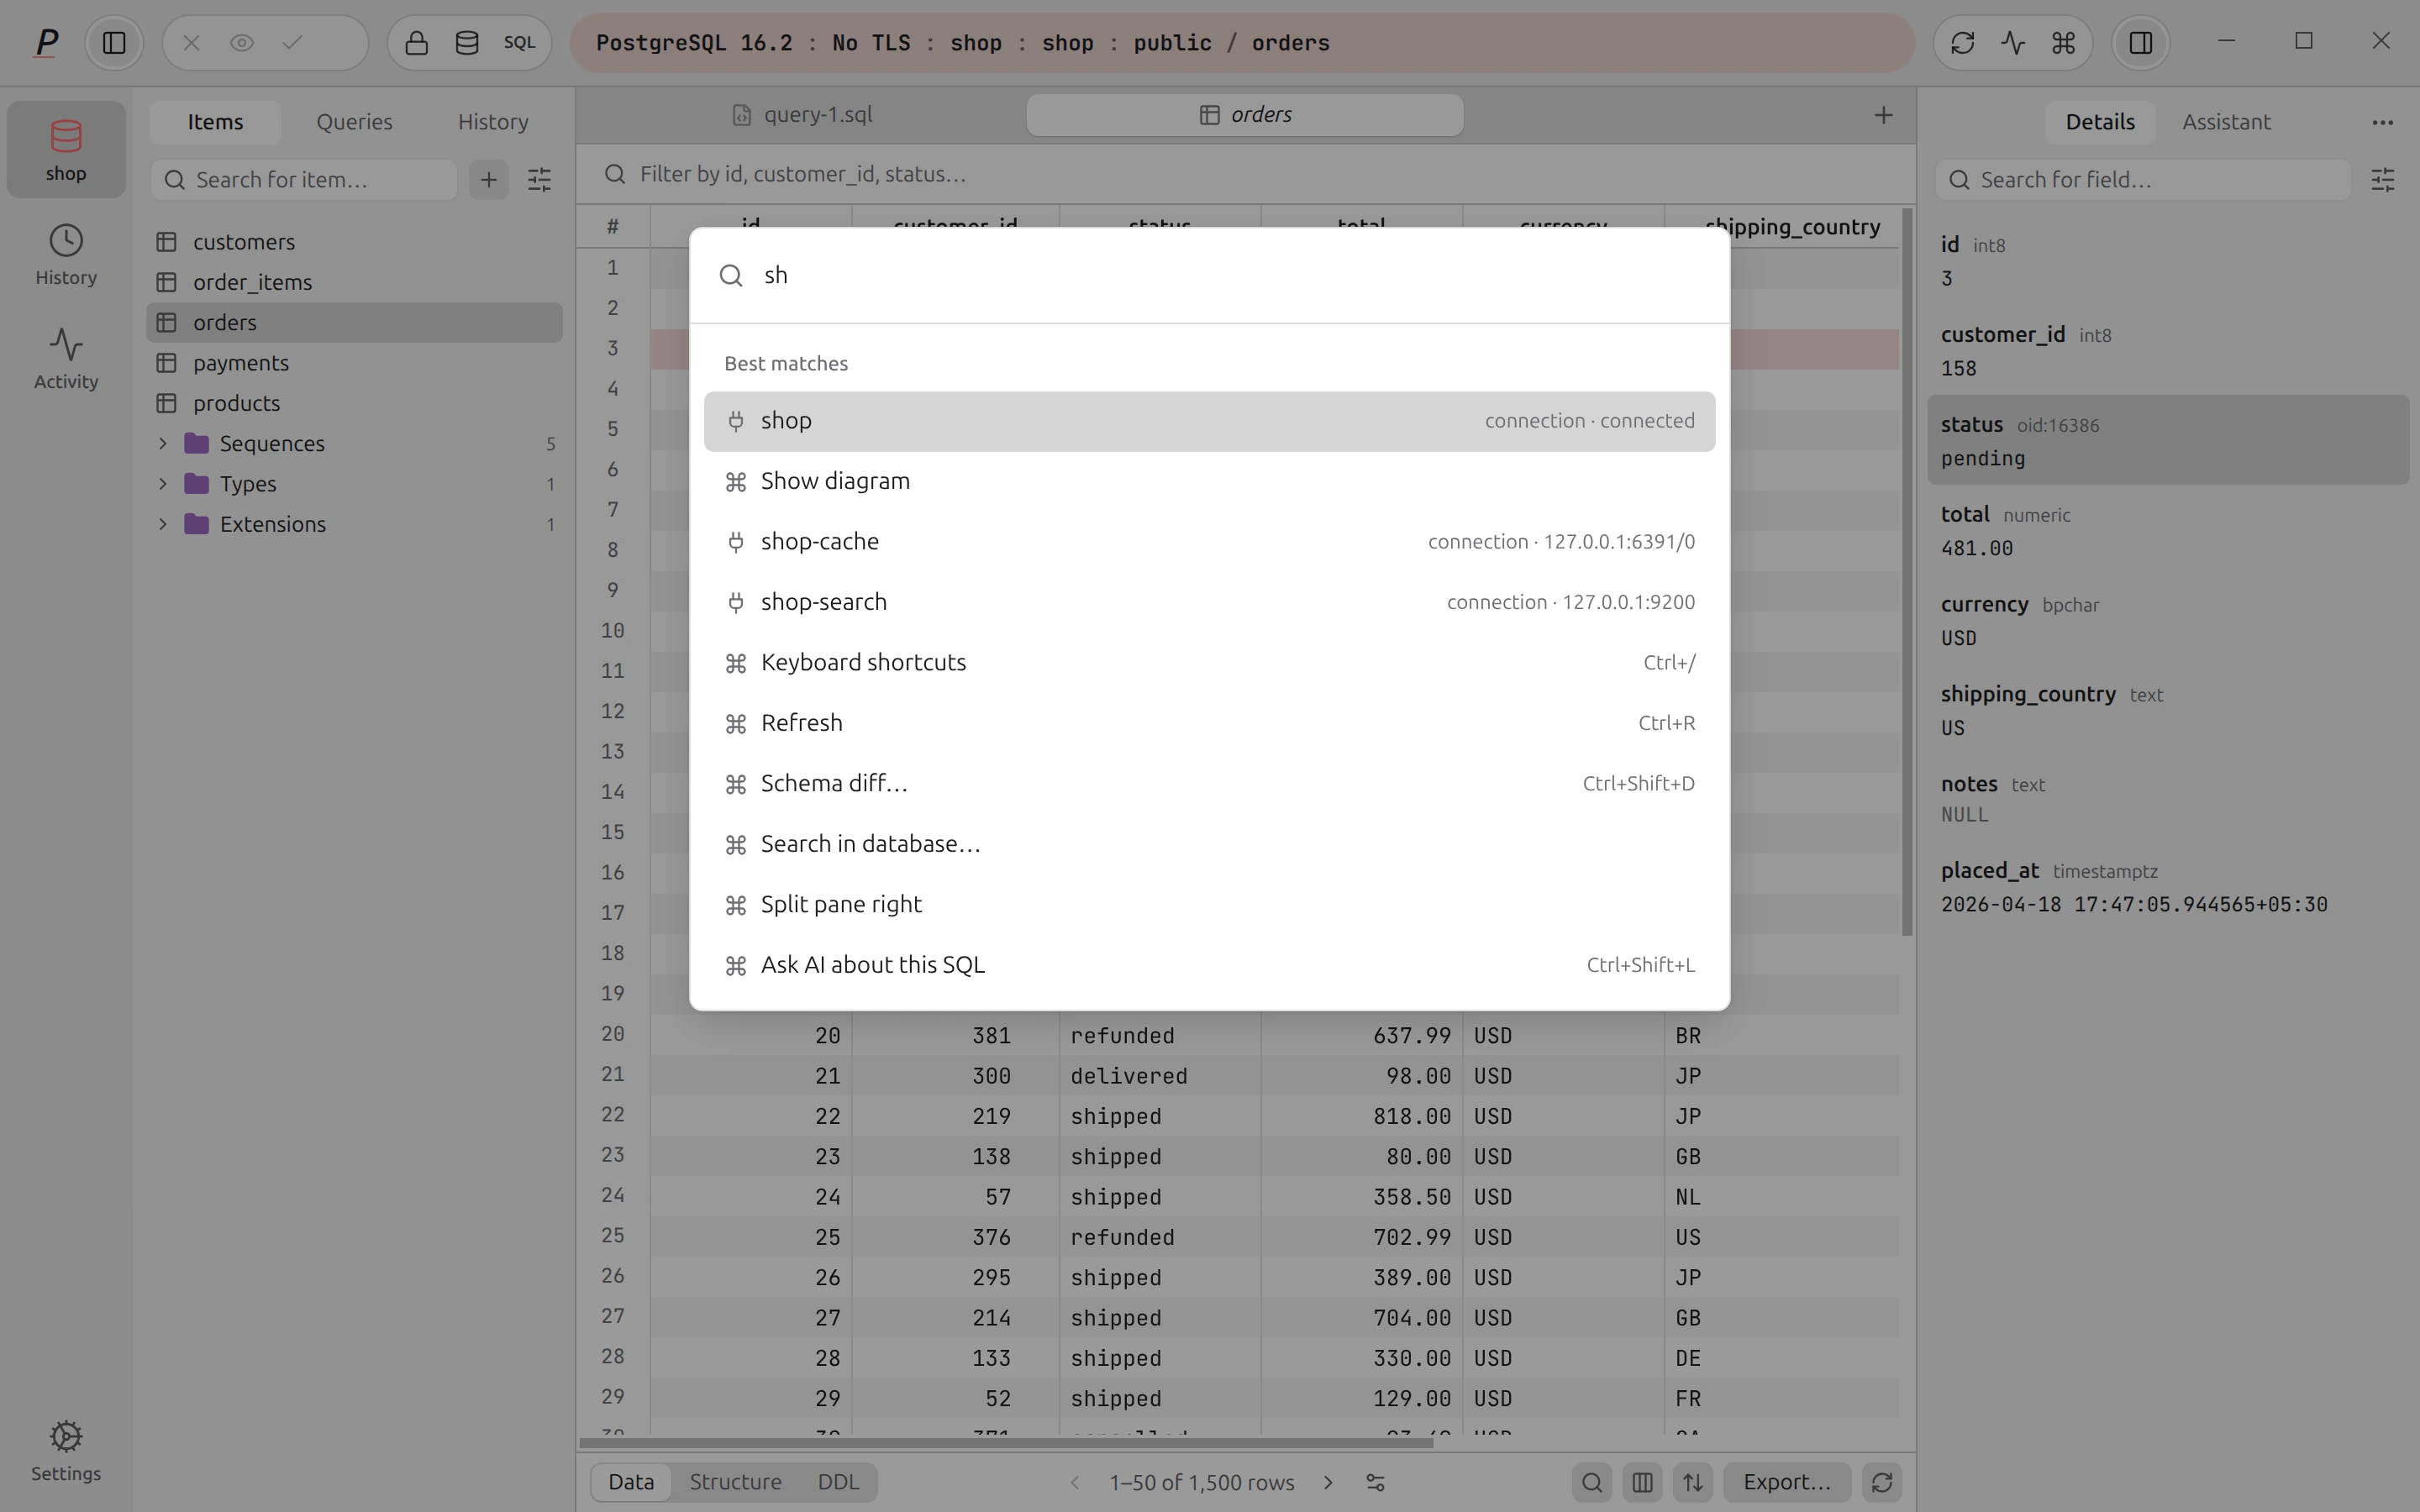
⌘KCtrl+K opens one search box over everything: tables, open tabs, saved queries, Redis keys, OpenSearch indices, saved connections and every command (run, export, back up, diagram, settings and so on). Its placeholder reads “Search tables, tabs, saved queries, actions…”. Commands that do not apply to the connected engine are hidden.
Redis and OpenSearch workbenches#
Redis and OpenSearch have no tables and no SQL editor, so their workbench looks different: a key tree or index list in the sidebar, an Overview tab, and views for search, CLI, console and so on. They are described on Redis and OpenSearch.
Where to go next#
- SQL editor: run statements, Safe Run, history, EXPLAIN, notebooks.
- Results and editing data: filter, sort, edit cells and commit safely.
- Safety and privacy: what Plasma does to stop dangerous changes.
- Keyboard shortcuts.